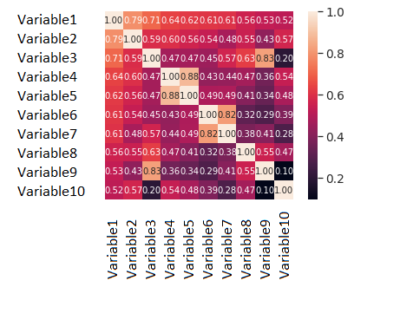
In the previous newsletter, we’ve talked about how creating an MMM framework simplifies the approach to an unknown dataset and presented an automated correlation analysis. Now we’ll present a different section which digs deeper and can guide us towards shedding light over which and how variables affect each other.
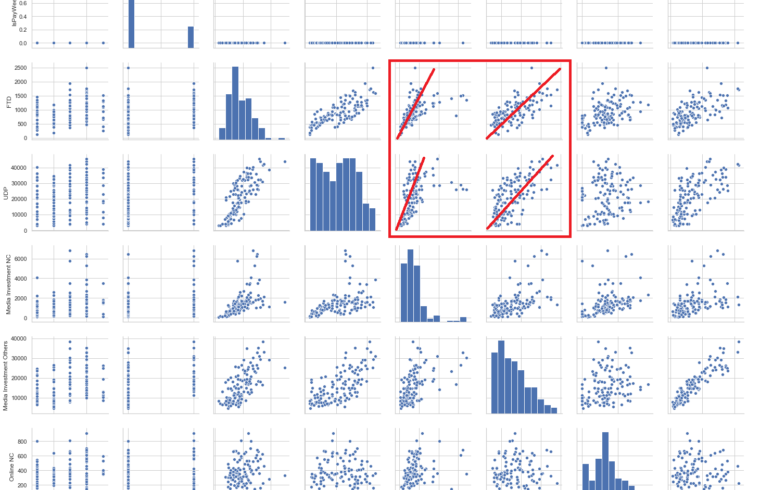
One of the key visualisations is a lattice graph, where we will create scatter plots for each combination of variables. The more linear the dataset appears, there is more probability that we’re in presence of two variables that move together.
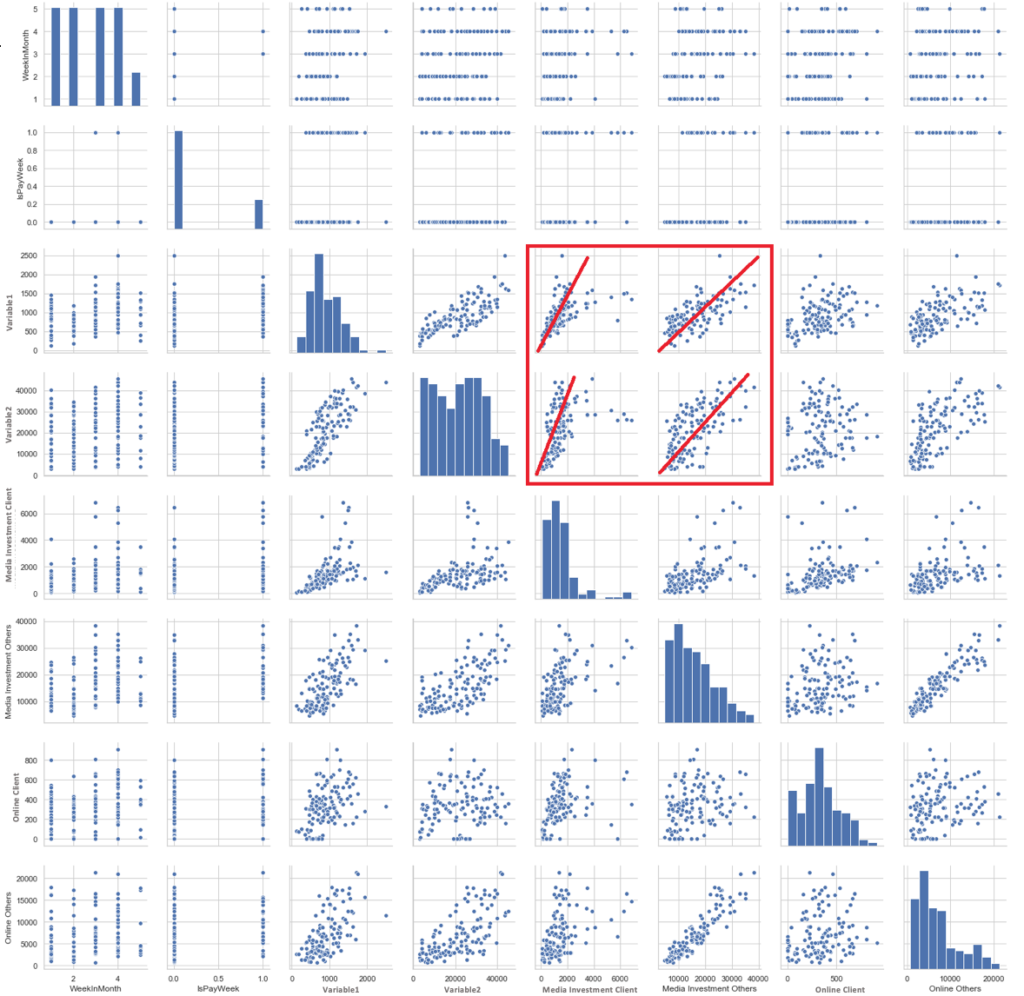
Here we can analyse two variables of business relevance (namely Variable1 and Variable2) and see how both are more sensitive to higher media investment from the company than to the general media investment in the market. This example finding validates the hypothesis that media investment is done correctly in a general sense. A follow up investigation will show which channels are optimal for investment to further enhance ROI.
ANALYZING RELEVANT FACTS
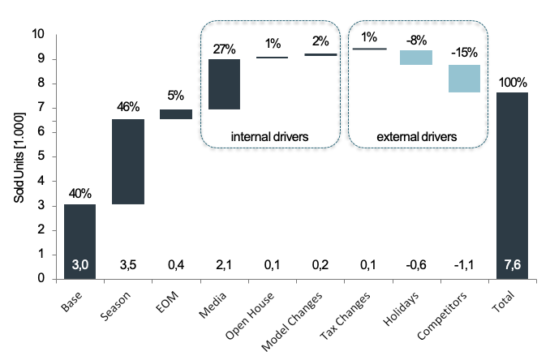
Datasets alone are not enough for explaining sudden changes. There is a need for the business to state which relevant facts could have been affecting their outcome. That’s the reason why one of the most important sources in an MMM model is the Relevant Facts sheet – where the business points out dates where events that affect the whole business happened. Then is up to us to discard or confirm the effect of each fact.
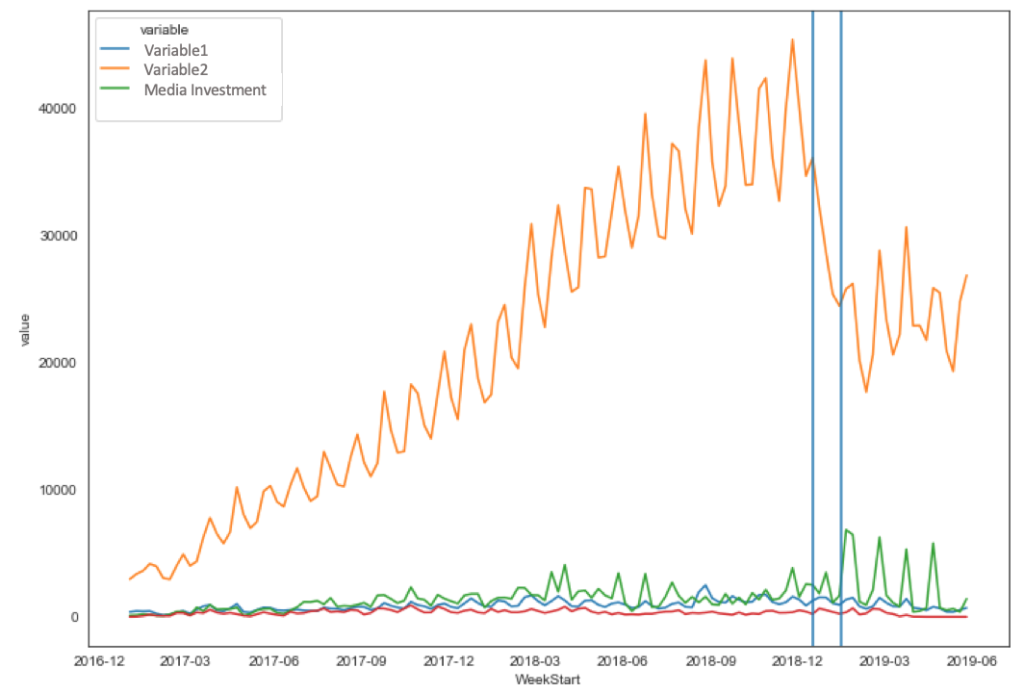
Here we can see how these 2 relevant facts in blue affected negatively the main business KPI. In this particular case, due to regulations, there was a technical change that had huge influence on the analysed variable and then its roll-out to the business.
If you too want to learn more about your marketing, do contact us by clicking on the button below.