R is a programming language and an environment developed in 1993, what is generally used for statistics. It’s free and can be used on many platforms such as Microsoft Windows, Linux and Mac OS.
R consists of the core and packages. While just using the core part you can write simple commands, but for more complex situations you would need to install specially designed packages for the analysis you want to do. The most popular package is Tidyverse, which includes many libraries like ggplot2 – to visualise the data and tidyr – to clean and filter the data.
You can use R straight in the console window, but it’s more convenient to use a specially made environment called RStudio. To use RStudio you would have to know the basics of coding, but there are alternatives. For example, there is a UI (User Interface) called Plotly, where you can program without knowing how to code: https://plot.ly/create/#/
To finish off the Intro to R, we give you a moving trending chart example from Deepanshu Bhalla. It shows the Indian general election results for 1984–2019.
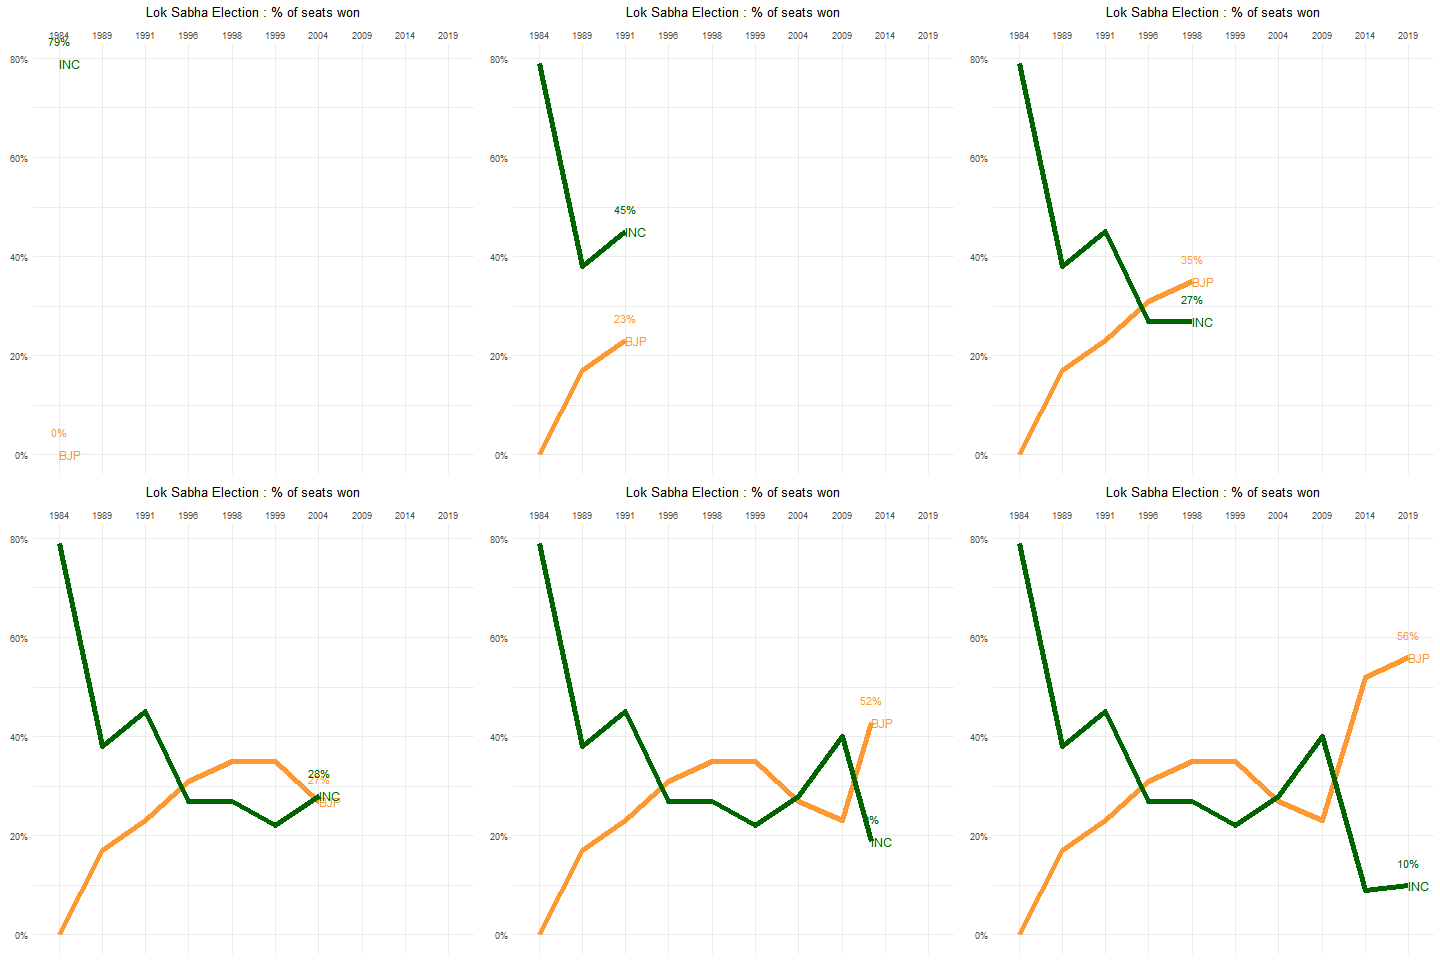
At the same time, for this simple chart you would need to normalise the data and write 17 lines of code.

More info: http://www.sascommunity.org/planet/blog/category/r/
If you need any help with R, don’t hesitate to contact us by clicking the button below.


