A geographic information system (GIS) is a framework for gathering, managing, and analyzing data. Rooted in the science of geography, GIS integrates many types of data. It analyzes spatial location (spatial is defined as something related to space) and organizes layers of information into visualizations using maps and 3D scenes. With this unique capability, GIS reveals deeper insights into data, such as patterns, relationships, and situations—helping users make smarter decisions.
Maps are the geographic container for the data layers and analytics you want to work with. GIS maps are easily shared and embedded in apps, and accessible by virtually everyone, everywhere.
GIS integrates many different kinds of data layers using spatial location. Most data has a geographic component. GIS data includes imagery, features, and basemaps linked to spreadsheets and tables.
Spatial analysis lets you evaluate suitability and capability, estimate and predict, interpret and understand, and much more, lending new perspectives to your insight and decision-making.
Using Tableau as a GIS interface
Tableau is a market leader tool in Business Intelligence and, as a suite, it has embedded GIS capabilities.
Being able to combine GIS information with your own data can provide insights that other visualisations simply can’t: many things only make sense while drawn on a map.
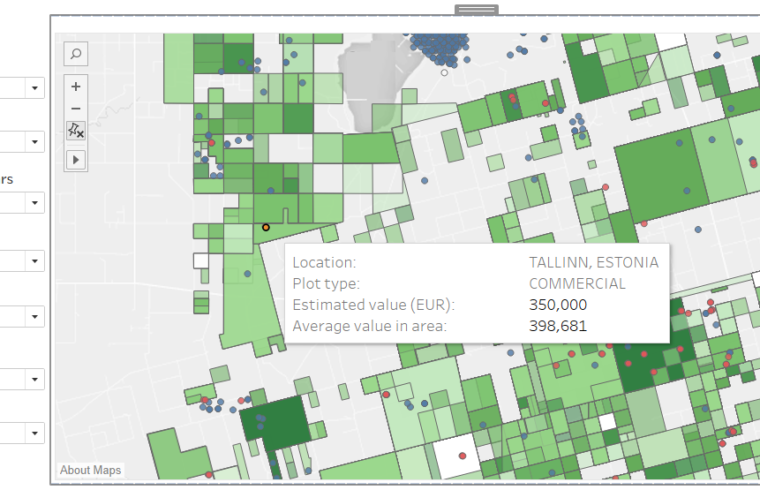
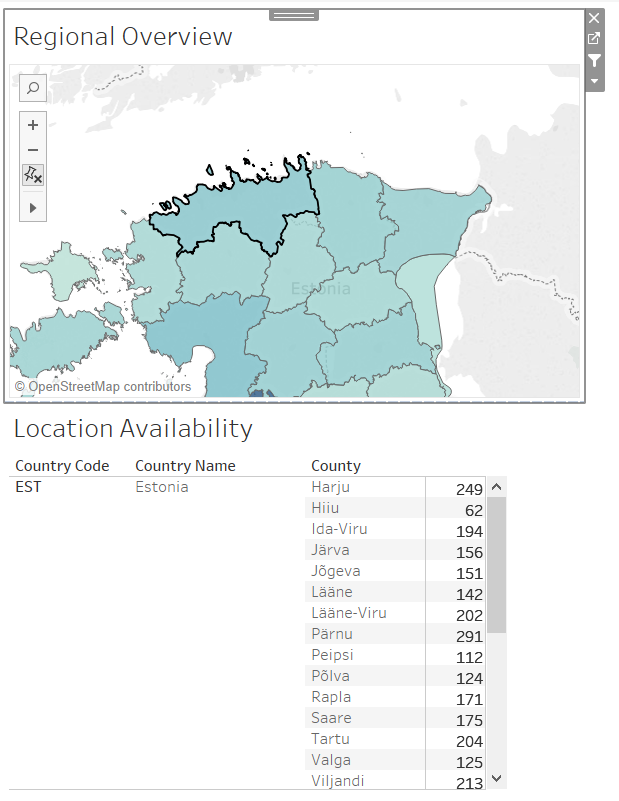
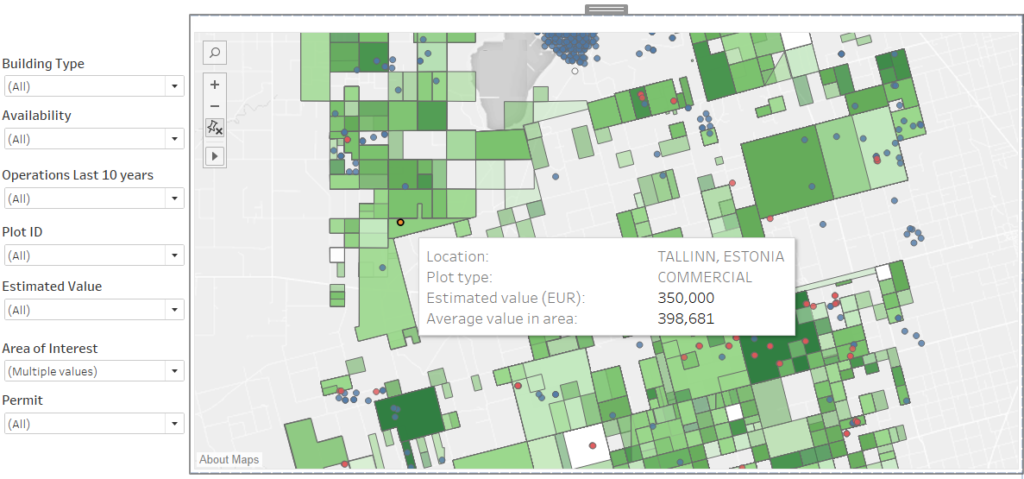
Here’s an example of a real estate application where you can analyse different plots and targets easily by combining existing information and presenting it visually either as polygons or dots on a map.
Why and when shall we use Tableau?
When in need of:
1. Easily Embeddable Visualisations:
Tableau provides great data visualisations at scale, making it easy for users to analyse data by using differentiating factors like colors, labels, and shapes.
All Tableau visualisations can be embedded in a website using Javascript controls.
2. Greater Insights:
Tableau allows the user to analyse data without any specific goals in mind. You can freely explore the visualisations and look for different insights. By using “what if” queries you can adjust data hypothetically and visualise data components dynamically for comparisons. When combined with real-time data these capabilities enhance dramatically.
3. Ease of Use:
Tableau is designed for people who don’t have coding skills. With Tableau, anyone can visualise and understand what’s happening, without external assistance.
If you need any assistance with a GIS graph or with Tableau, you can reach us by clicking on the button below: